
The main tools of cartography in the digital age are all computer based. There are three types of computer programs that almost all maps are made with these days. Sometimes only one is employed, sometimes all three. Here is a short introduction.
The first are the vector drawing programs like Adobe Illustrator. They deal mainly with vector artwork, which consists of points connected by vectors, commonly known as lines. Vector artwork tends to have smaller files sizes and can be enlarged almost infinitely without losing quality. On a map, elements like roads, contours, rivers, etc. are usually drawn in vector.
The next group are tools like Photoshop that are designed to work with raster data, or pictures that are made up of many small pixels. Raster artwork can have very large files sizes and can only be enlarged to within the limits of the image resolution before degrading. Shaded relief on a map is raster data.

Raster vs. Vector
Finally there are the Geographic Information Systems. GIS programs like ESRI ArcMap deal with both vector and raster data. The big difference is that a GIS also stores the coordinates of all the map elements, locating their exact position on the earth. GIS programs are very good at analyzing spatial questions and organizing vast amounts of geographic data, but they lack precise drawing tools. Many nice maps are constructed entirely within a GIS, but for complete control of style and aesthetic appearance, most cartographers turn to graphics programs.
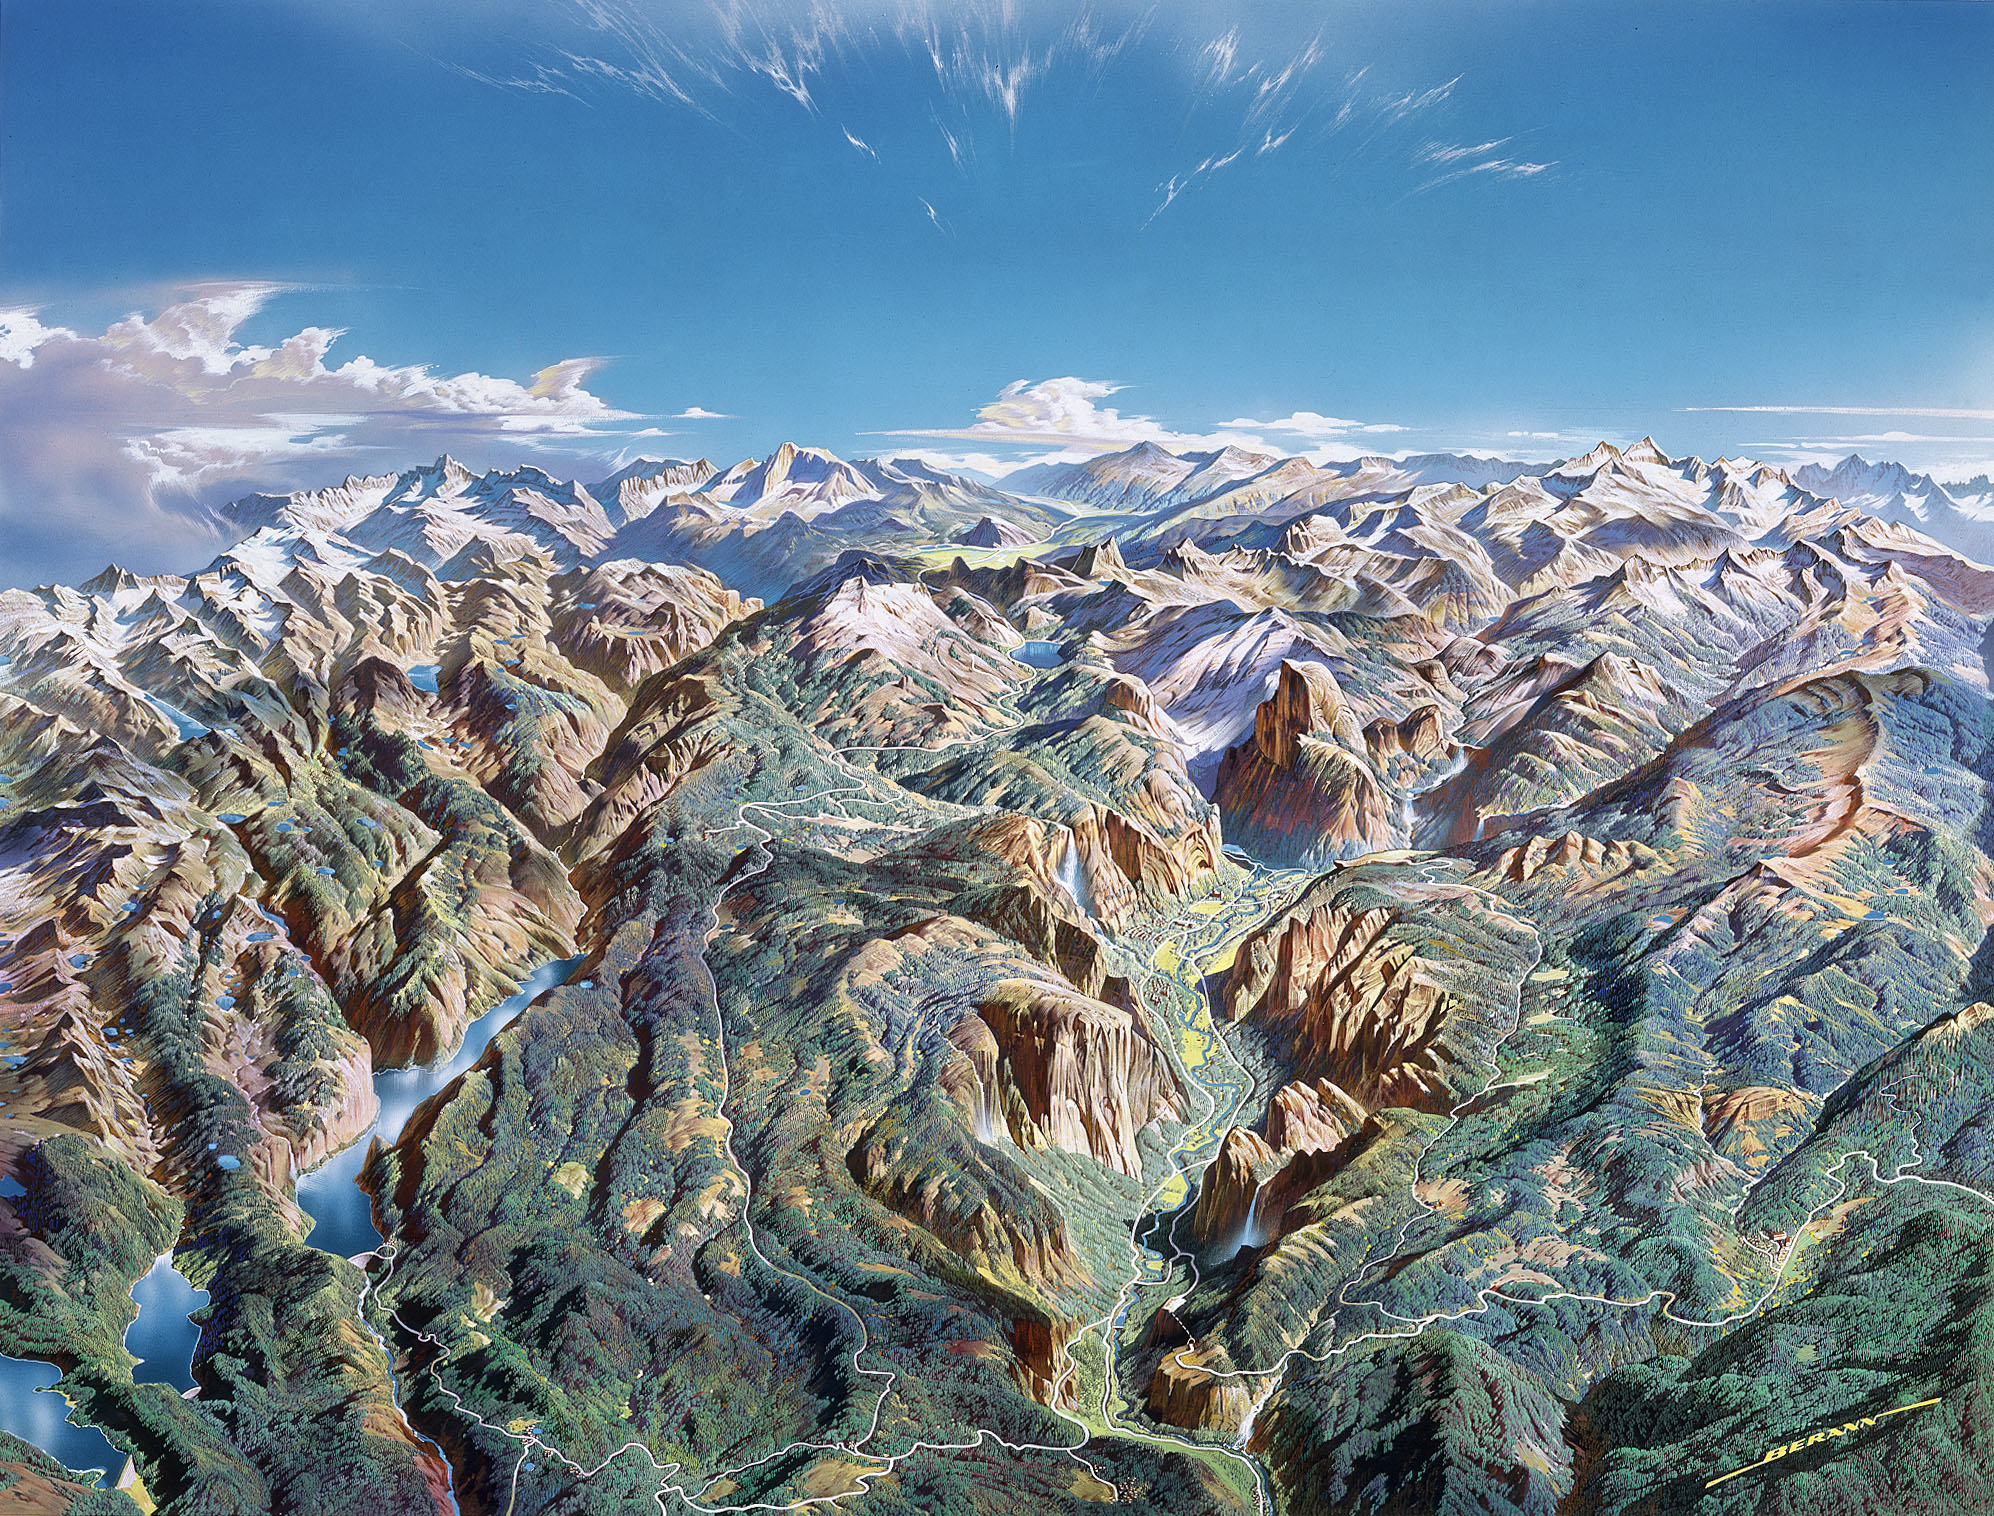
A common cartographic workflow would be to compile and organize all the map data in ArcMap, and then export the vectors and rasters out into separate files. The raster data would then be processed in Photoshop, while the vector data would be styled in Illustrator. Finally the raster could be placed beneath the vectors in Illustrator, and the map could be labeled and printed. Here is a map that was created in this way:

That’s one of the ways it’s done, so let’s do it!
Hi Kevin,
ReplyDeletejust discovered your blog which I think might be very interesting as you are sharing some knowledge.
I'm dealing Ok with Illustrator and Photoshop, but I would like to learn FROM THE VERY BEGINNING (!) how to use a GIS, as I'd like to focus on creating maps for various purposes.
Could you share some info about it ?
Thank you and all the best
Olivier
Olivier, that's on the menu in the next few weeks. We are going to do Illustartor the first third of the semester, then ArcMap, then workflow from GIS to Illustrator. I hope to give folks all the tools to make nice maps in 4 months, then it will get more advanced. Thanks for your interest!
ReplyDeleteHello, Kevin. I came across your blog while searching for references to cartography and tools of the trade. I am a writer, and am starting a story about 2 guys who want to map a cave. Are there any tips or hints you can share? Is there a specific name for those who map caves?
ReplyDeleteView my blog at http://iamyeehaw.blogspot.com/
I must tell you at present, I am unpublished, but am working on rectifying that. Thanks! John
Hi Kevin, do you know if there are any Raised Relief Maps available for Norway? Like the one in the link but covering the whole of Norway.
ReplyDeleteSorry Alan, I don't have any references for that off the top of my head. Sounds like a job for Google!
DeleteKevin